Smartphones have revolutionized the way we communicate and have boosted our productivity, allowing us to stay connected on the go.
Back in 2014, there were 1 billion smartphone users. Now, the number is nearly 5 billion and forecasted to reach 6 billion by 2027.
We’ll explore the latest statistics on smartphone usage, including smartphone habits across the world and in the US, how they’ve changed over the years.
Here’s what you’ll learn:
- Smartphone Usage Stats (Highlights)
- Time Spent Using Smartphones among Worldwide Users
- Time Spent Using Smartphones by Country
- Time Spent Using Smartphones in the US
- Number of Smartphone Users Worldwide
- Smartphone Ownership in the US
- Time Spent with Apps and Browsers Using Smartphones
Smartphone Usage Stats (Highlights)
- The average daily online activity on smartphones amounts to 3 hours and 50 minutes.
- Today, approximately 4.88 billion individuals own a smartphone. That’s set to grow to 6 billion by 2017.
- On average, smartphone users spend 4.37 hours per day using mobile apps.
- Time spent using smartphones among American adults grew from 3 hours 1.1 minutes in 2019 to 3 hours 54.8 minutes in 2024. That’s nearly an extra 1 hour of smartphone usage.
Time Spent Using Smartphones among Worldwide Users
According to Q3 2023 data, people spend an average 3 hours and 50 minutes online on their smartphones every day.
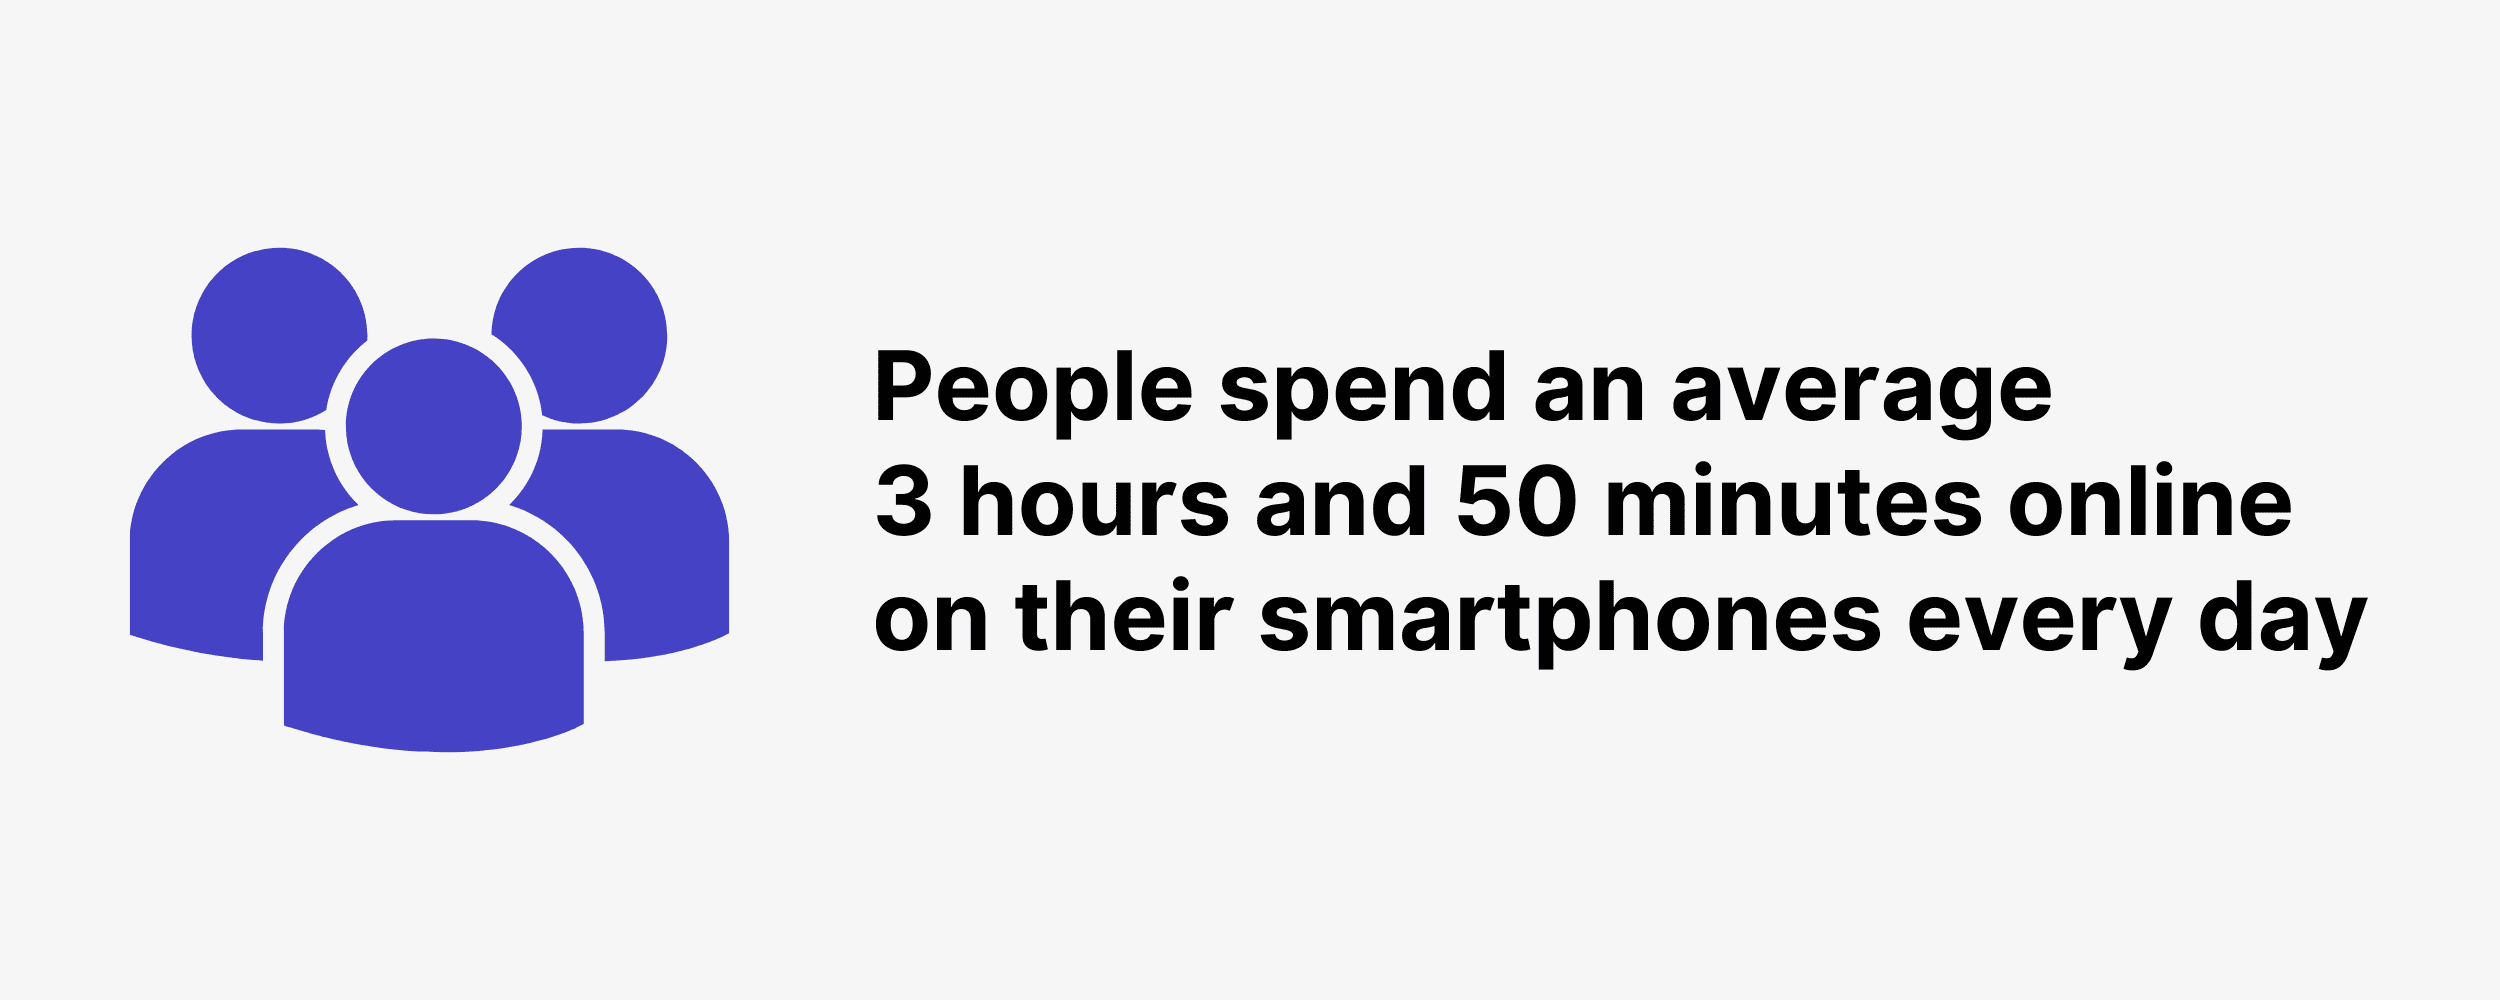
Daily smartphone usage currently varies between 1 hour and 54 minutes to 5 hours and 20 minutes depending on the market.
Mobile share accounts for 57.6% of daily internet time among users aged 16 to 64 worldwide.
We’ve charted daily online time using smartphones since 2014:
| Date | Daily Time Spent Using the Internet on Smartphones |
|---|---|
| 2014 | 1 hour 38 minutes |
| 2015 | 2 hours 2 minutes |
| 2016 | 2 hours 21 minutes |
| 2017 | 2 hours 31 minutes |
| Q2-Q3 2018 | 3 hours 6 minutes |
| Q3 2019 | 3 hours 22 minutes |
| Q3 2020 | 3 hours 39 minutes |
| Q3 2021 | 3 hours 43 minutes |
| Q3 2022 | 3 hours 46 minutes |
| Q3 2023 | 3 hours 50 minutes |
Source: DataReportal
Time Spent Using Smartphones by Country
On average, time spent on smartphones among users in 20 markets included in the analysis reached 4.37 hours per day in 2023.
Users in Indonesia spent the most daily time on smartphones, specifically 6.05 hours (the only country with 6 hours of usage included in the report), followed by Thailand (5.64 hours) and Argentina (5.33 hours).

Among users in the US, daily time using smartphones reached 4.43 hours in 2023 (down from 4.42 hours in 2022).
Here’s a detailed breakdown of time spent using smartphones across 20 markets:
| Country | Daily Time Spent on Smartphones (2023) | Daily Time Spent on Smartphones (2022) |
|---|---|---|
| Indonesia | 6.05 hours | 6.14 hours |
| Thailand | 5.64 hours | 5.54 hours |
| Argentina | 5.33 hours | 4.95 hours |
| Saudi Arabia | 5.28 hours | 5.29 hours |
| Brazil | 5.02 hours | 4.82 hours |
| India | 4.77 hours | 4.67 hours |
| Mexico | 4.7 hours | 4.44 hours |
| Singapore | 4.51 hours | 4.43 hours |
| South Korea | 4.51 hours | 4.72 hours |
| Turkey | 4.45 hours | 4.34 hours |
| US | 4.34 hours | 4.42 hours |
| UK | 3.81 hours | 3.83 hours |
| Canada | 3.8 hours | 3.65 hours |
| Japan | 3.77 hours | 3.57 hours |
| Italy | 3.77 hours | 3.79 hours |
| China | 3.72 hours | 3.49 hours |
| Spain | 3.64 hours | 3.62 hours |
| France | 3.61 hours | 3.61 hours |
| Germany | 3.42 hours | 3.42 hours |
| Australia | 3.35 hours | 3.25 hours |
Source: data.ai
Time Spent Using Smartphones in the US
American adults (ages 18+) estimated to spend an average of 3 hours 45 minutes per day on internet activities using smartphones in 2024.
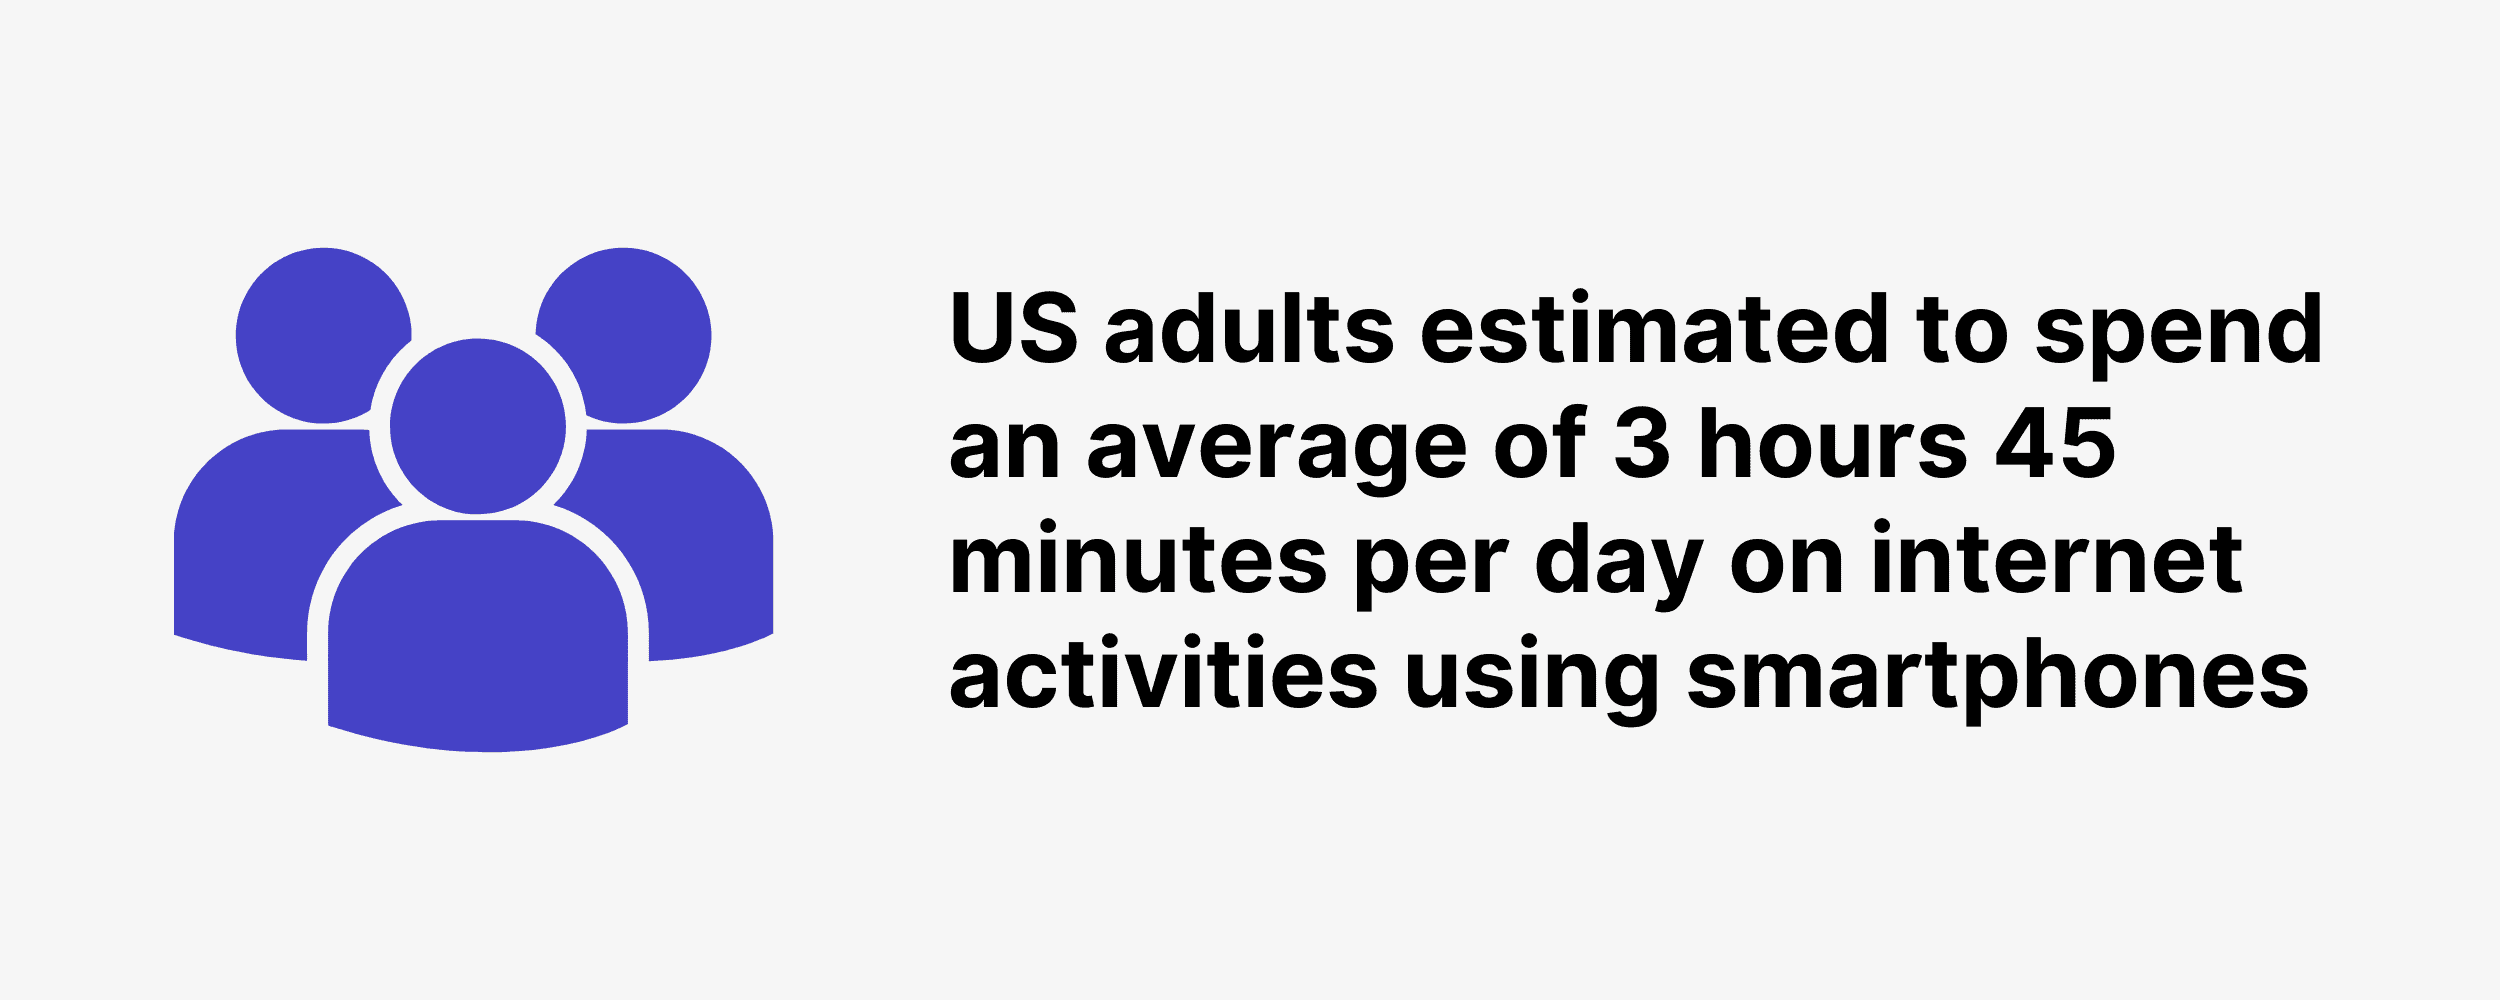
Smartphone usage increased by nearly an hour (53.7 minutes) in 2024 compared to 2019.
We’ve charted time spent with internet activities on smartphones in the US since 2019:
| Year | Daily Smartphone Usage in the US |
|---|---|
| 2019 | 3 hours 1.1 minutes |
| 2020 | 3 hours 24.5 minutes |
| 2021 | 3 hours 37 minutes |
| 2022 | 3 hours 45 minutes |
| 2023 | 3 hours 50.3 minutes |
| 2024 | 3 hours 54.8 minutes |
| 2025 | 3 hours 58.5 minutes |
Source: eMarketer
Number of Smartphone Users Worldwide
As of 2024, an estimated 4.88 billion people own a smartphone. That’s an increase of 635 million new smartphone users over the past year alone (between 2023 and 2024).
Number of smartphone users worldwide grew by 2.15x since 2020, adding 2.61 billion new smartphone owners over time.
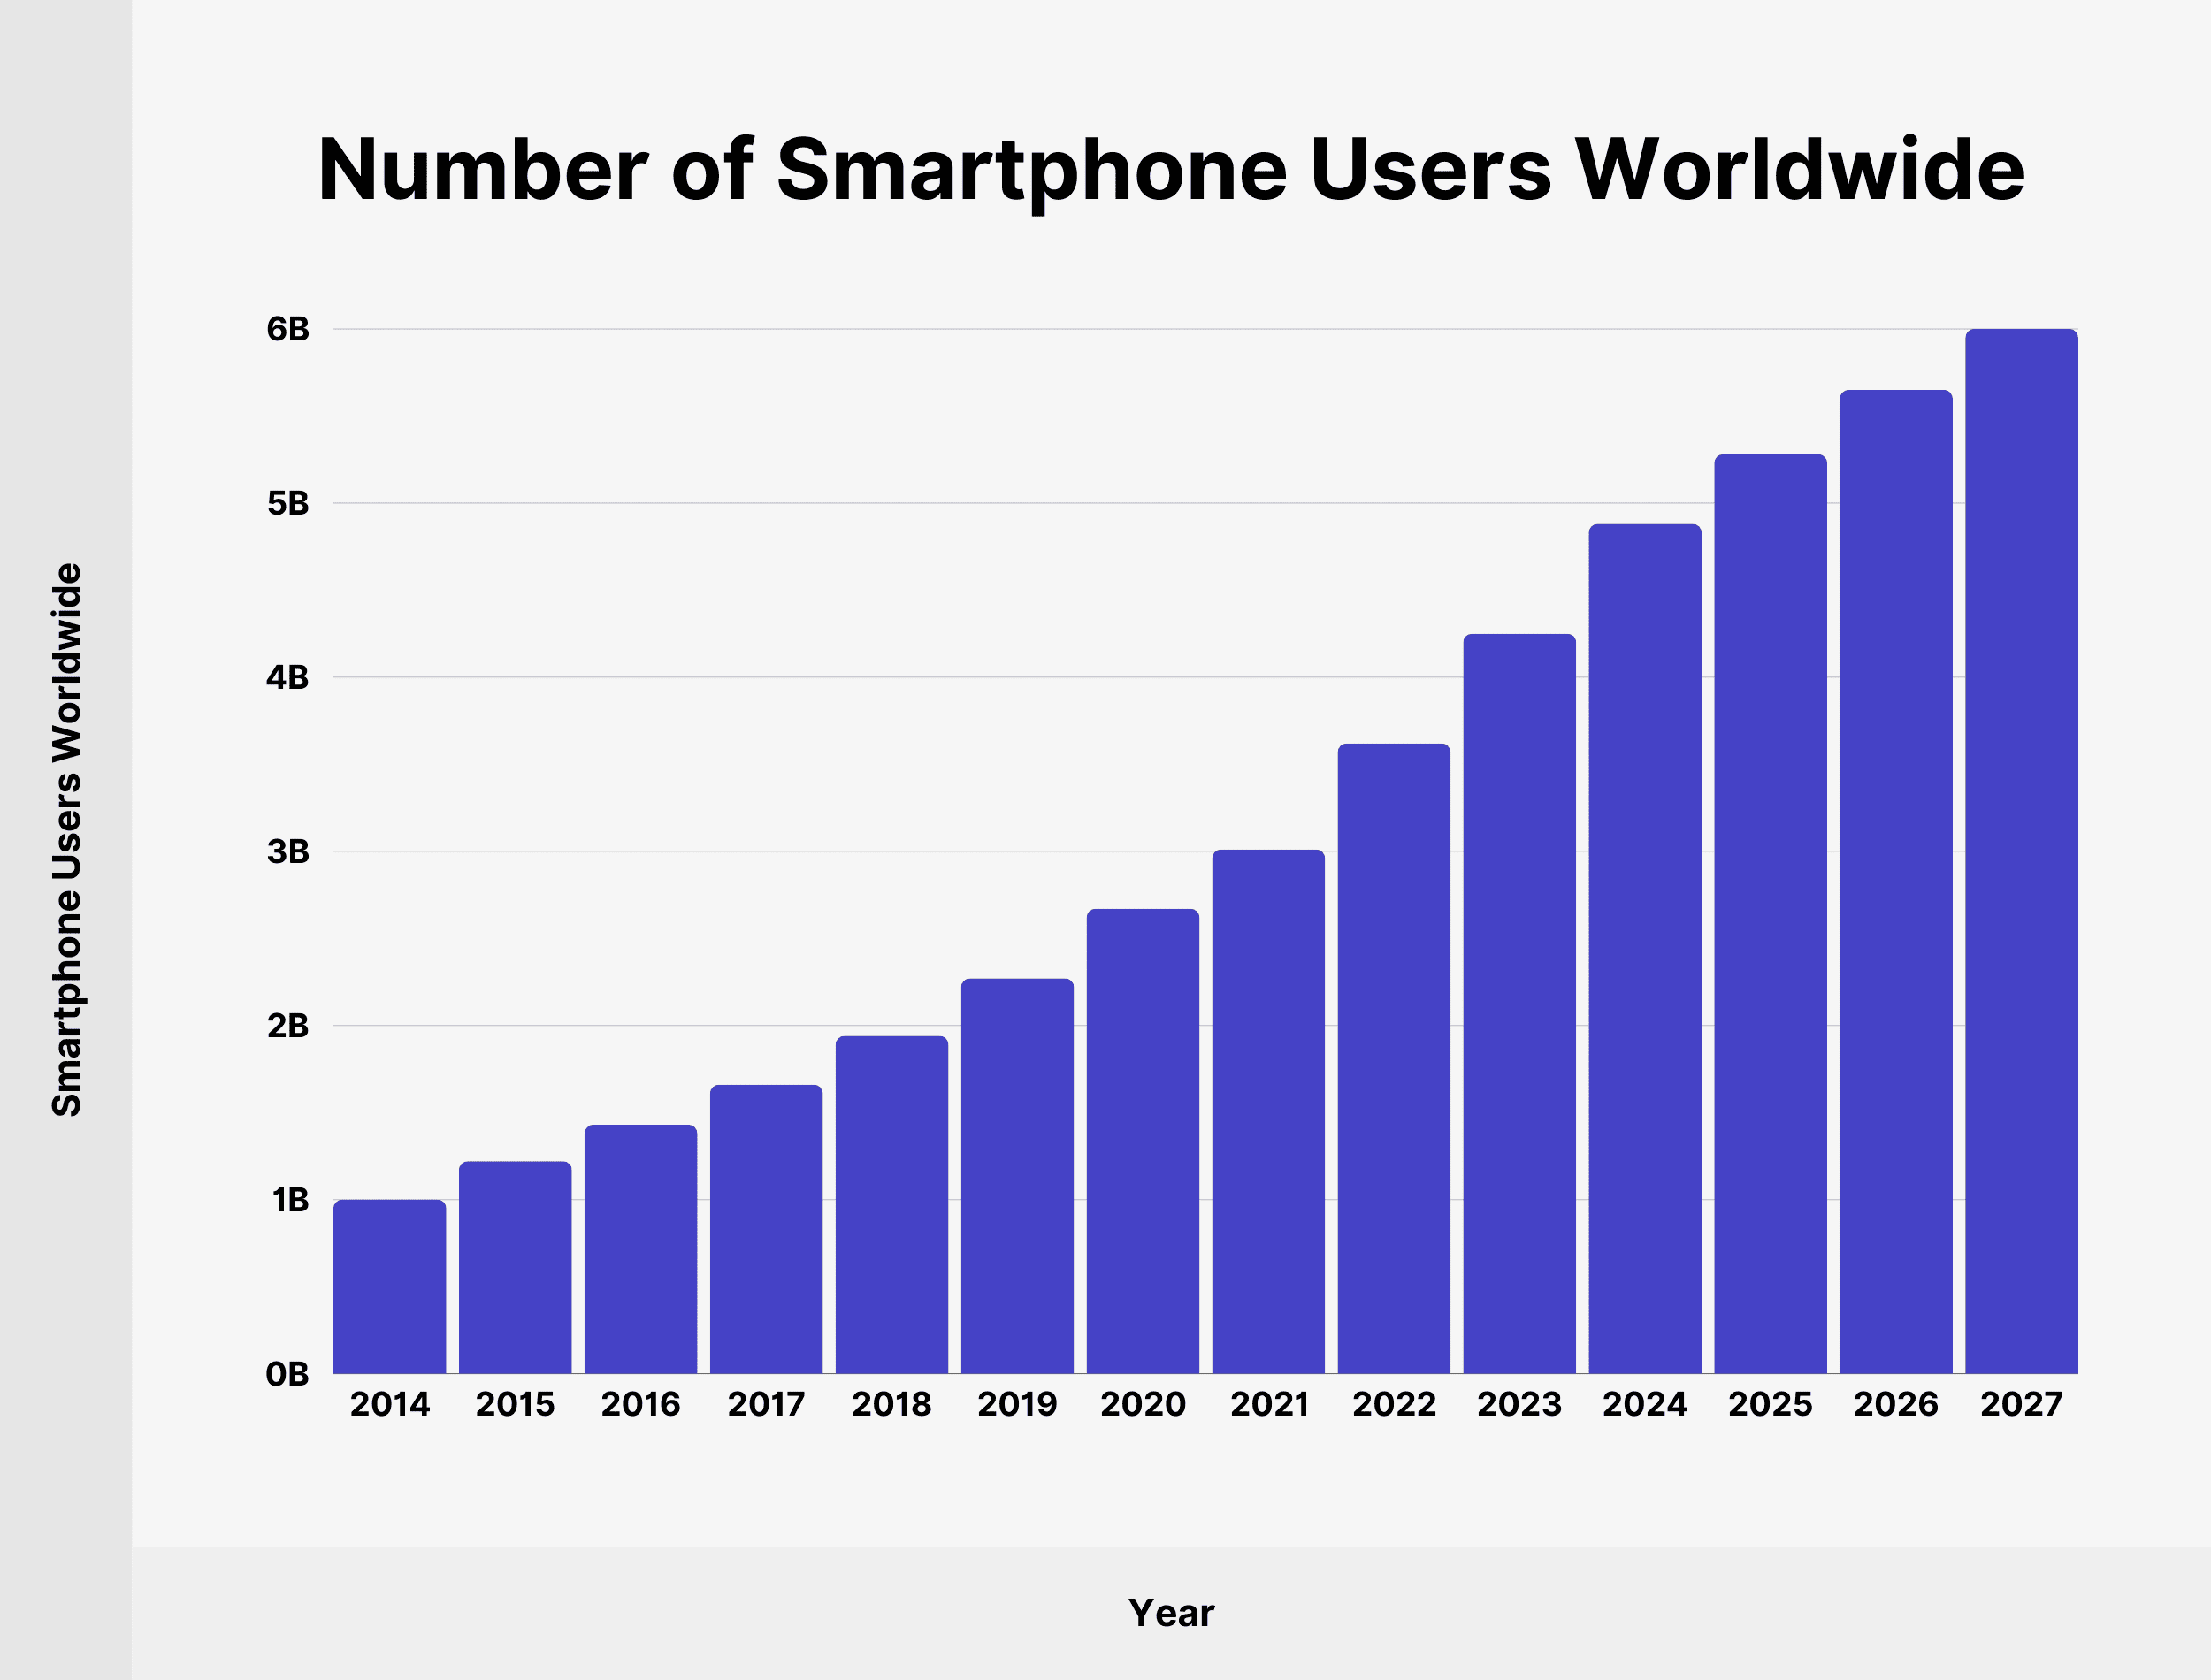
Here’s a table with a number of smartphone users worldwide over time since 2014:
| Year | Smartphone Users Worldwide |
|---|---|
| 2014 | 1 billion |
| 2015 | 1.22 billion |
| 2016 | 1.43 billion |
| 2017 | 1.66 billion |
| 2018 | 1.94 billion |
| 2019 | 2.27 billion |
| 2020 | 2.67 billion |
| 2021 | 3.01 billion |
| 2022 | 3.62 billion |
| 2023 | 4.25 billion |
| 2024 | 4.88 billion |
| 2025 | 5.28 billion |
| 2026 | 5.65 billion |
| 2027 | 6 billion |
Source: Statista
Smartphone Ownership in the US
Around 90% of adults in the US currently own a smartphone, up from 59% ownership rate in December 2014.
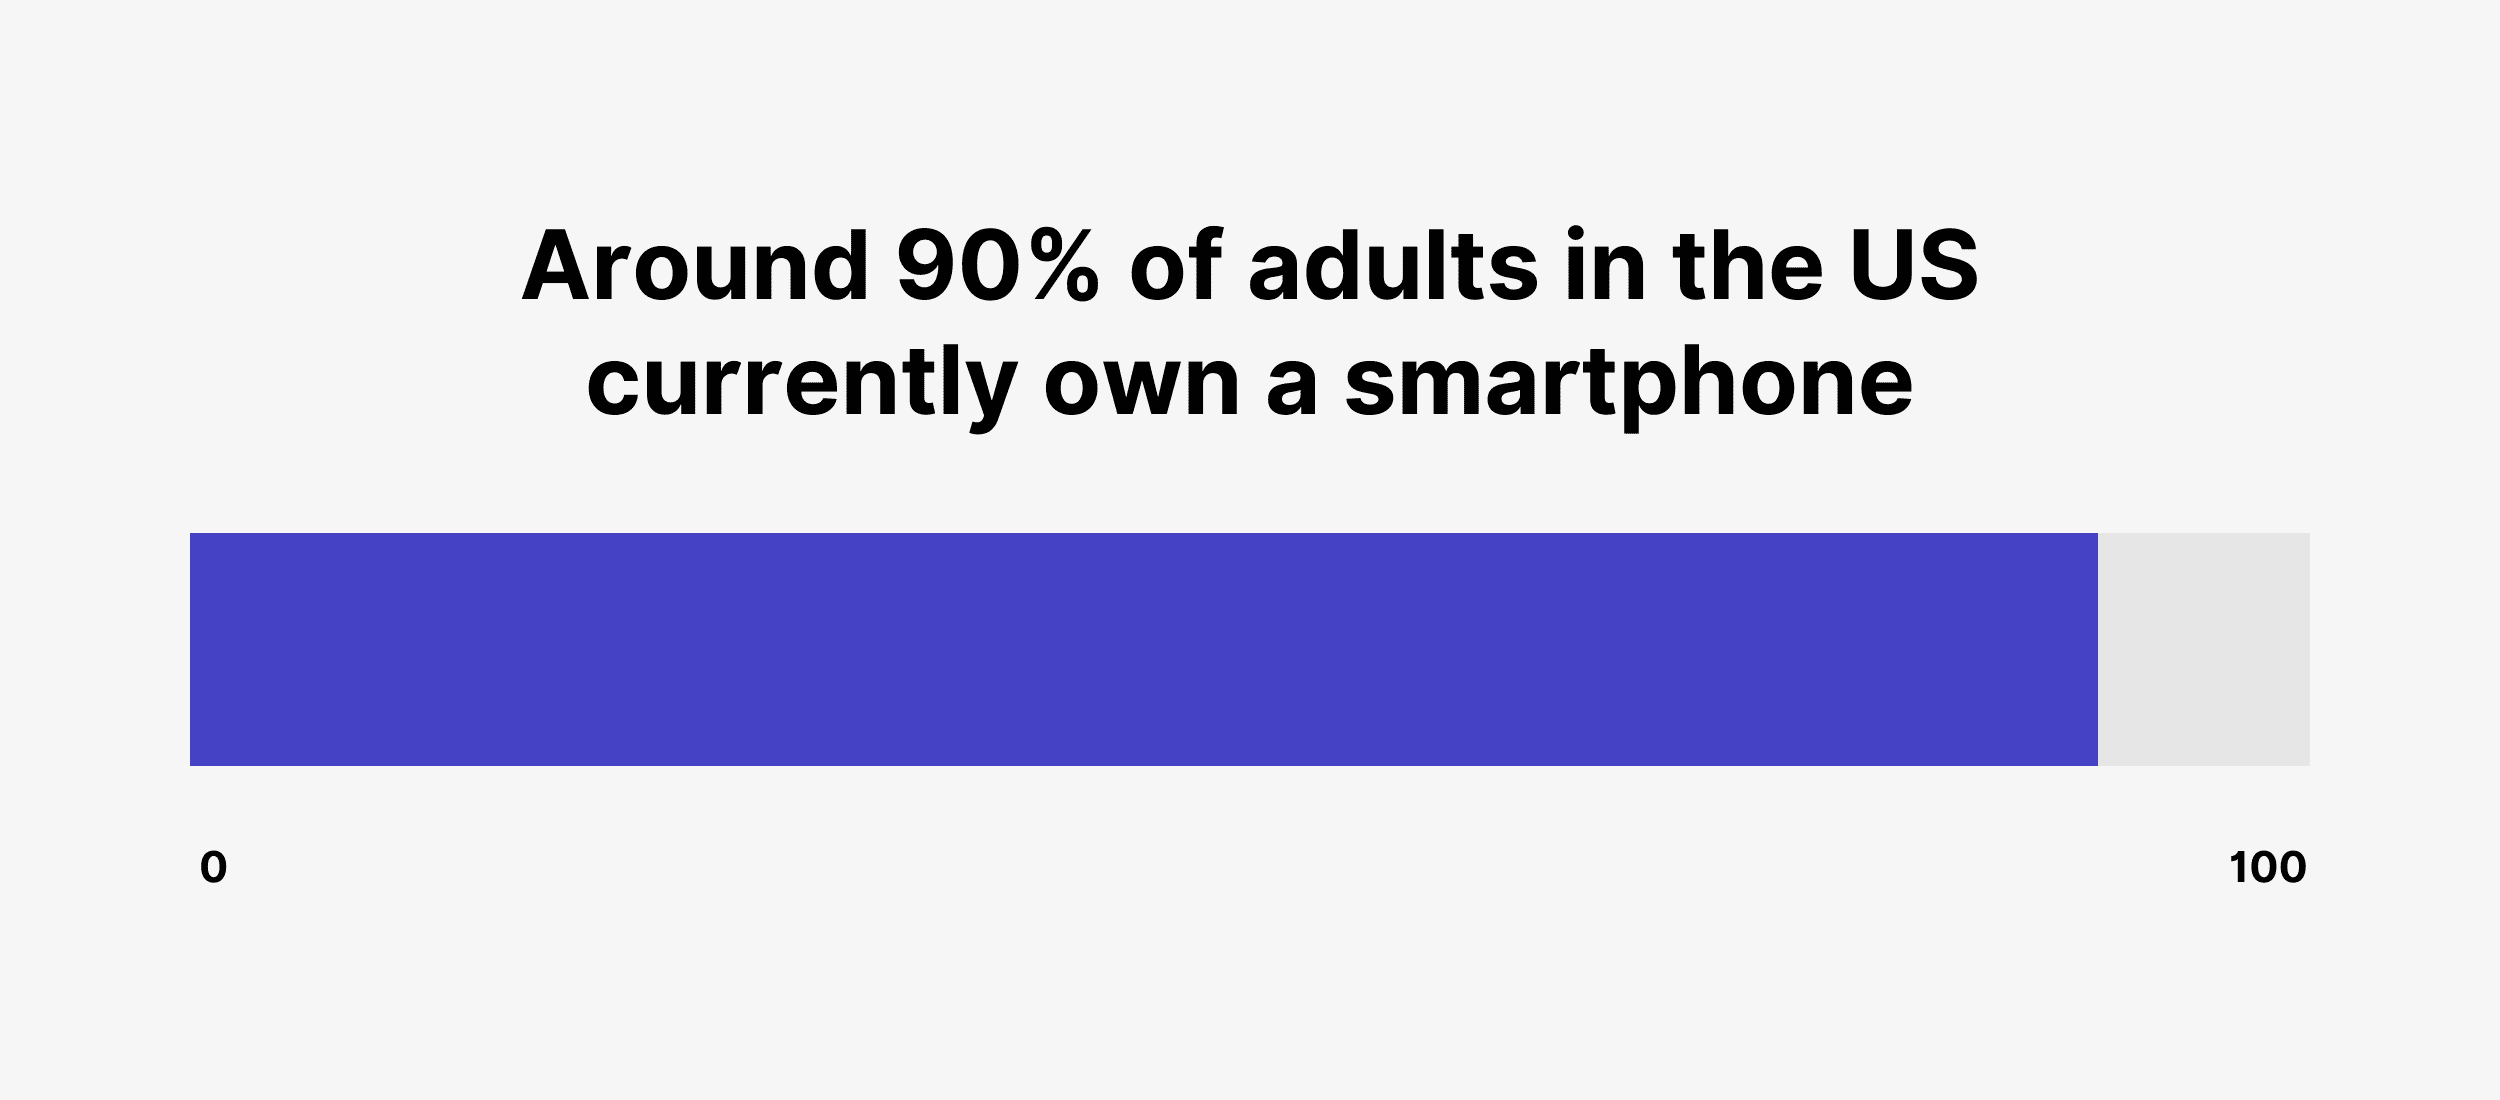
In 2013, more than half (51%) of US adults owned a smartphone for the first time during the survey period (2011-2023) and continued to grow since then.
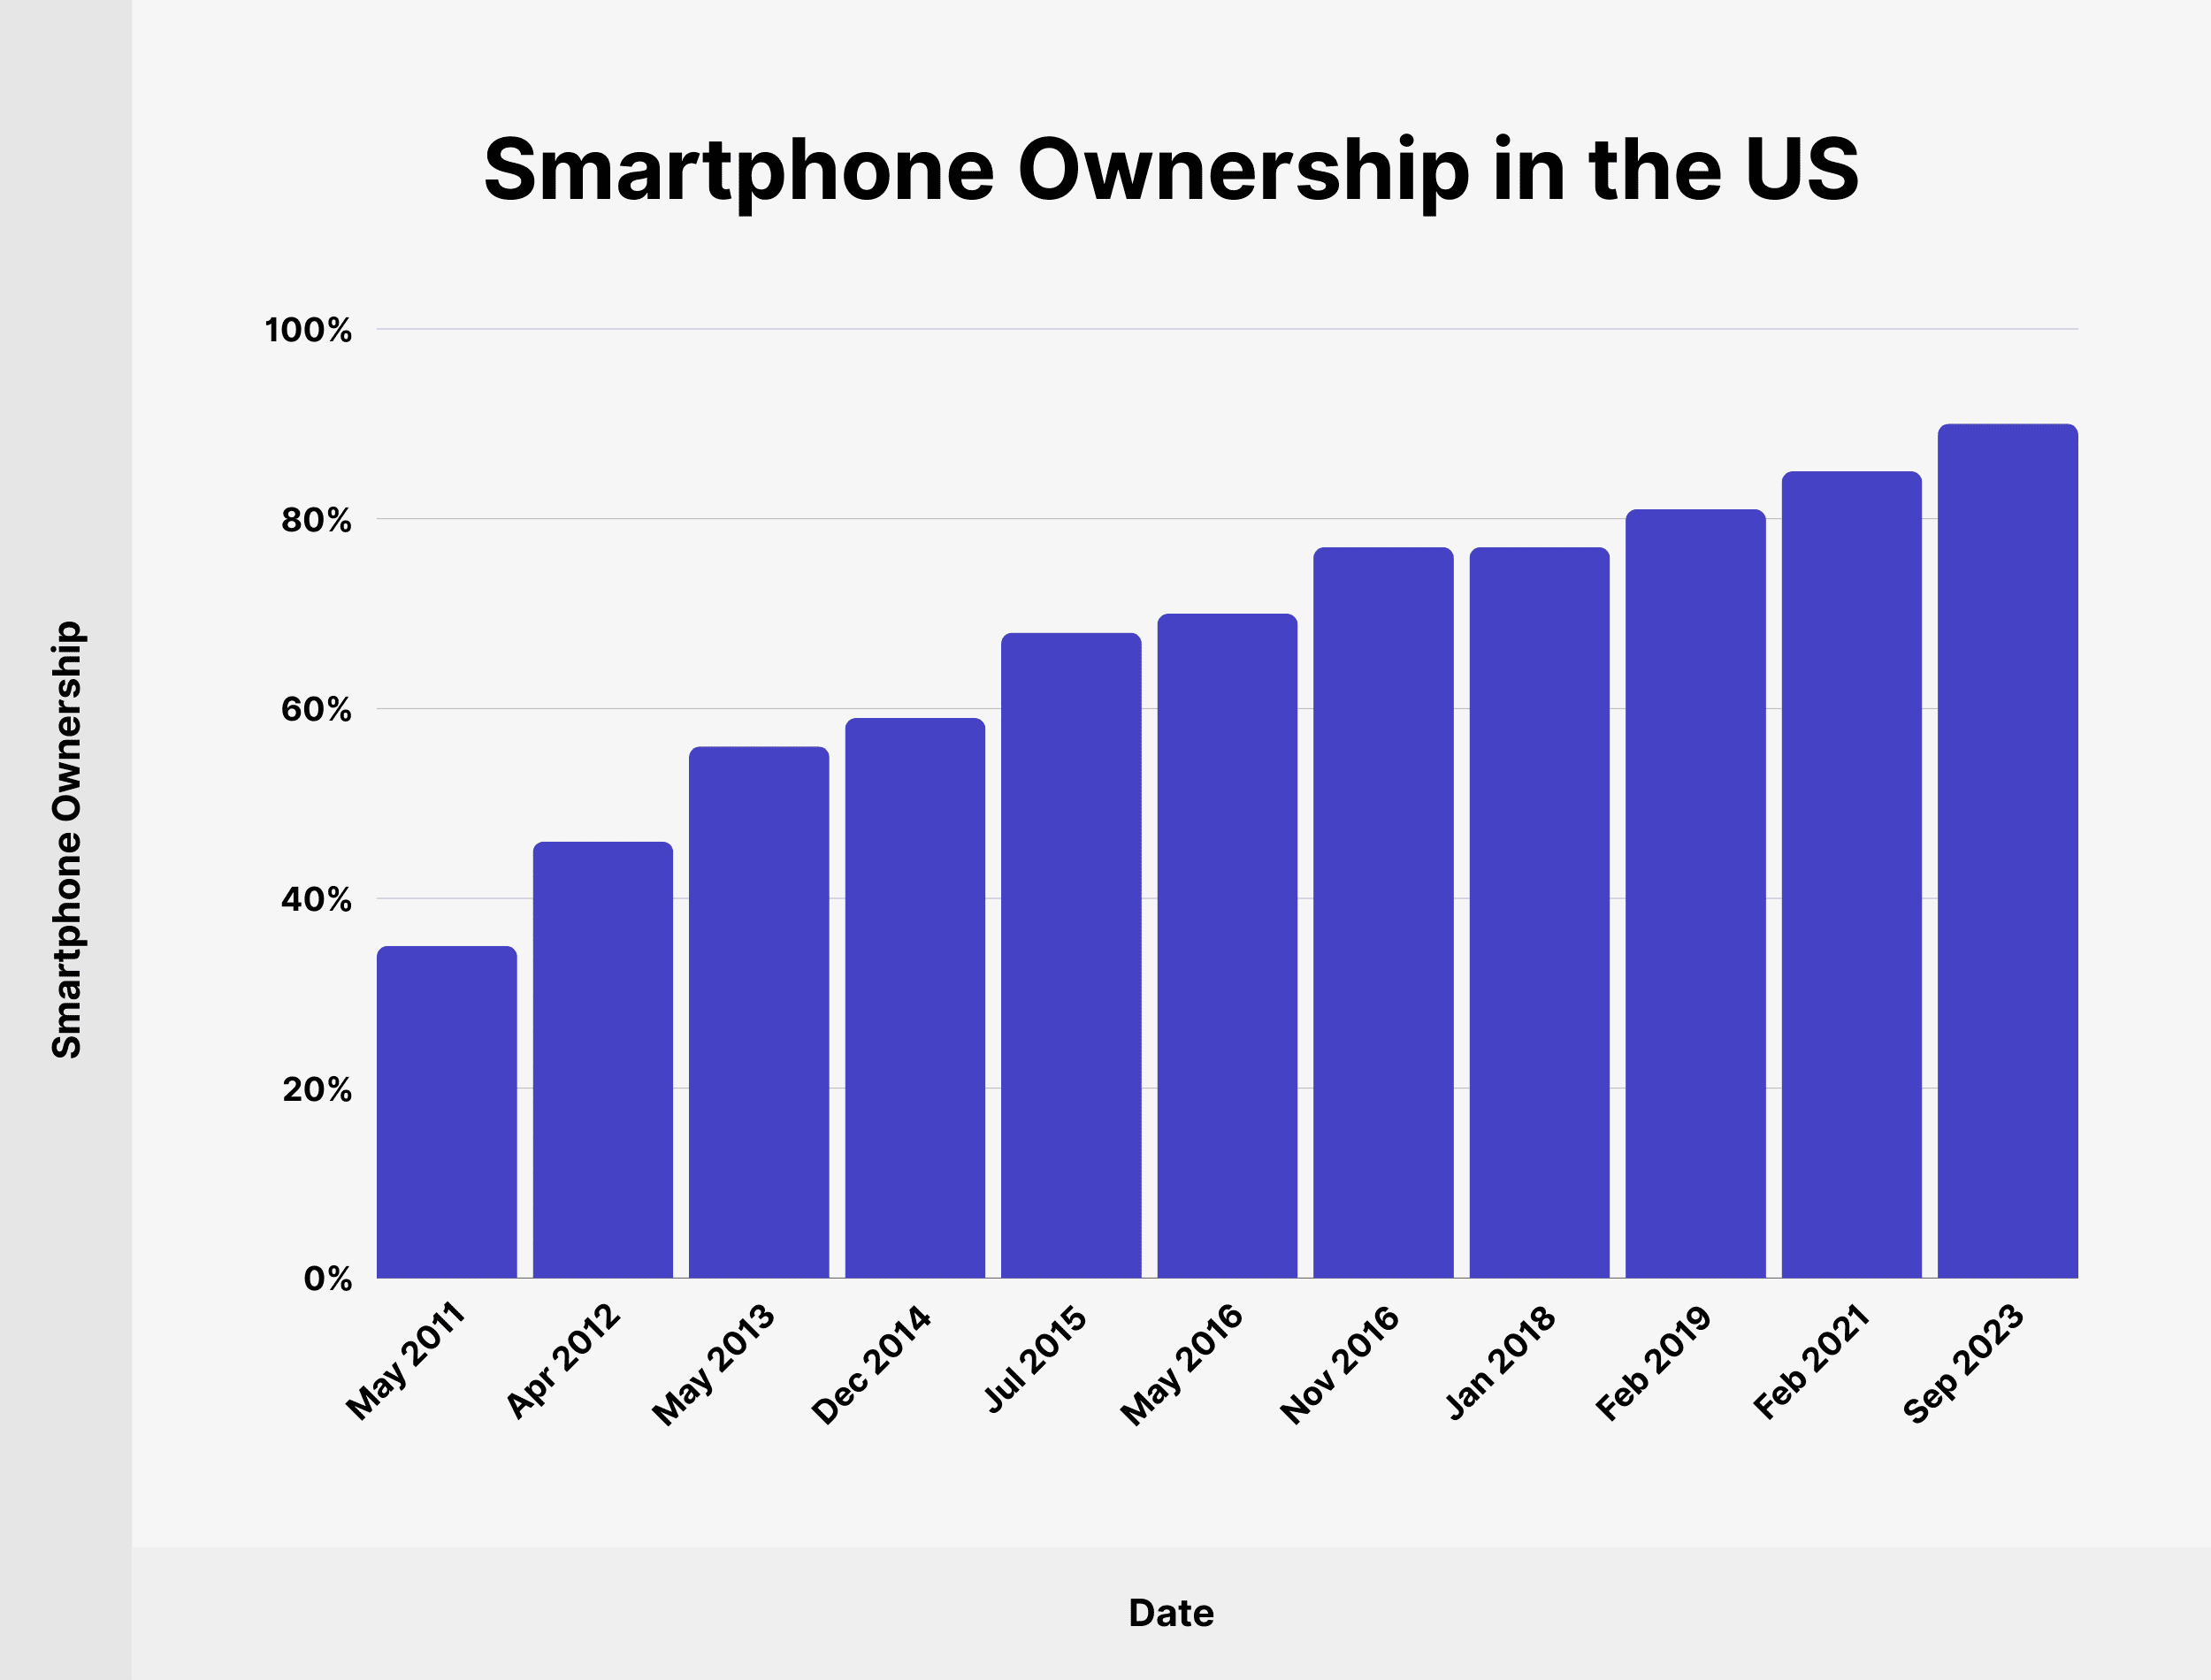
We’ve charted smartphone ownership growth in the US since 2011:
| Date | Smartphone Ownership |
|---|---|
| May 2011 | 35% |
| April 2012 | 46% |
| May 2013 | 56% |
| December 2014 | 59% |
| July 2015 | 68% |
| May 2016 | 70% |
| November 2016 | 77% |
| January 2018 | 77% |
| February 2019 | 81% |
| February 2021 | 85% |
| September 2023 | 90% |
Source: Pew Research Center
Time Spent with Apps and Browsers Using Smartphones
Smartphone users devoting a larger share of their time to apps rather than browsers.
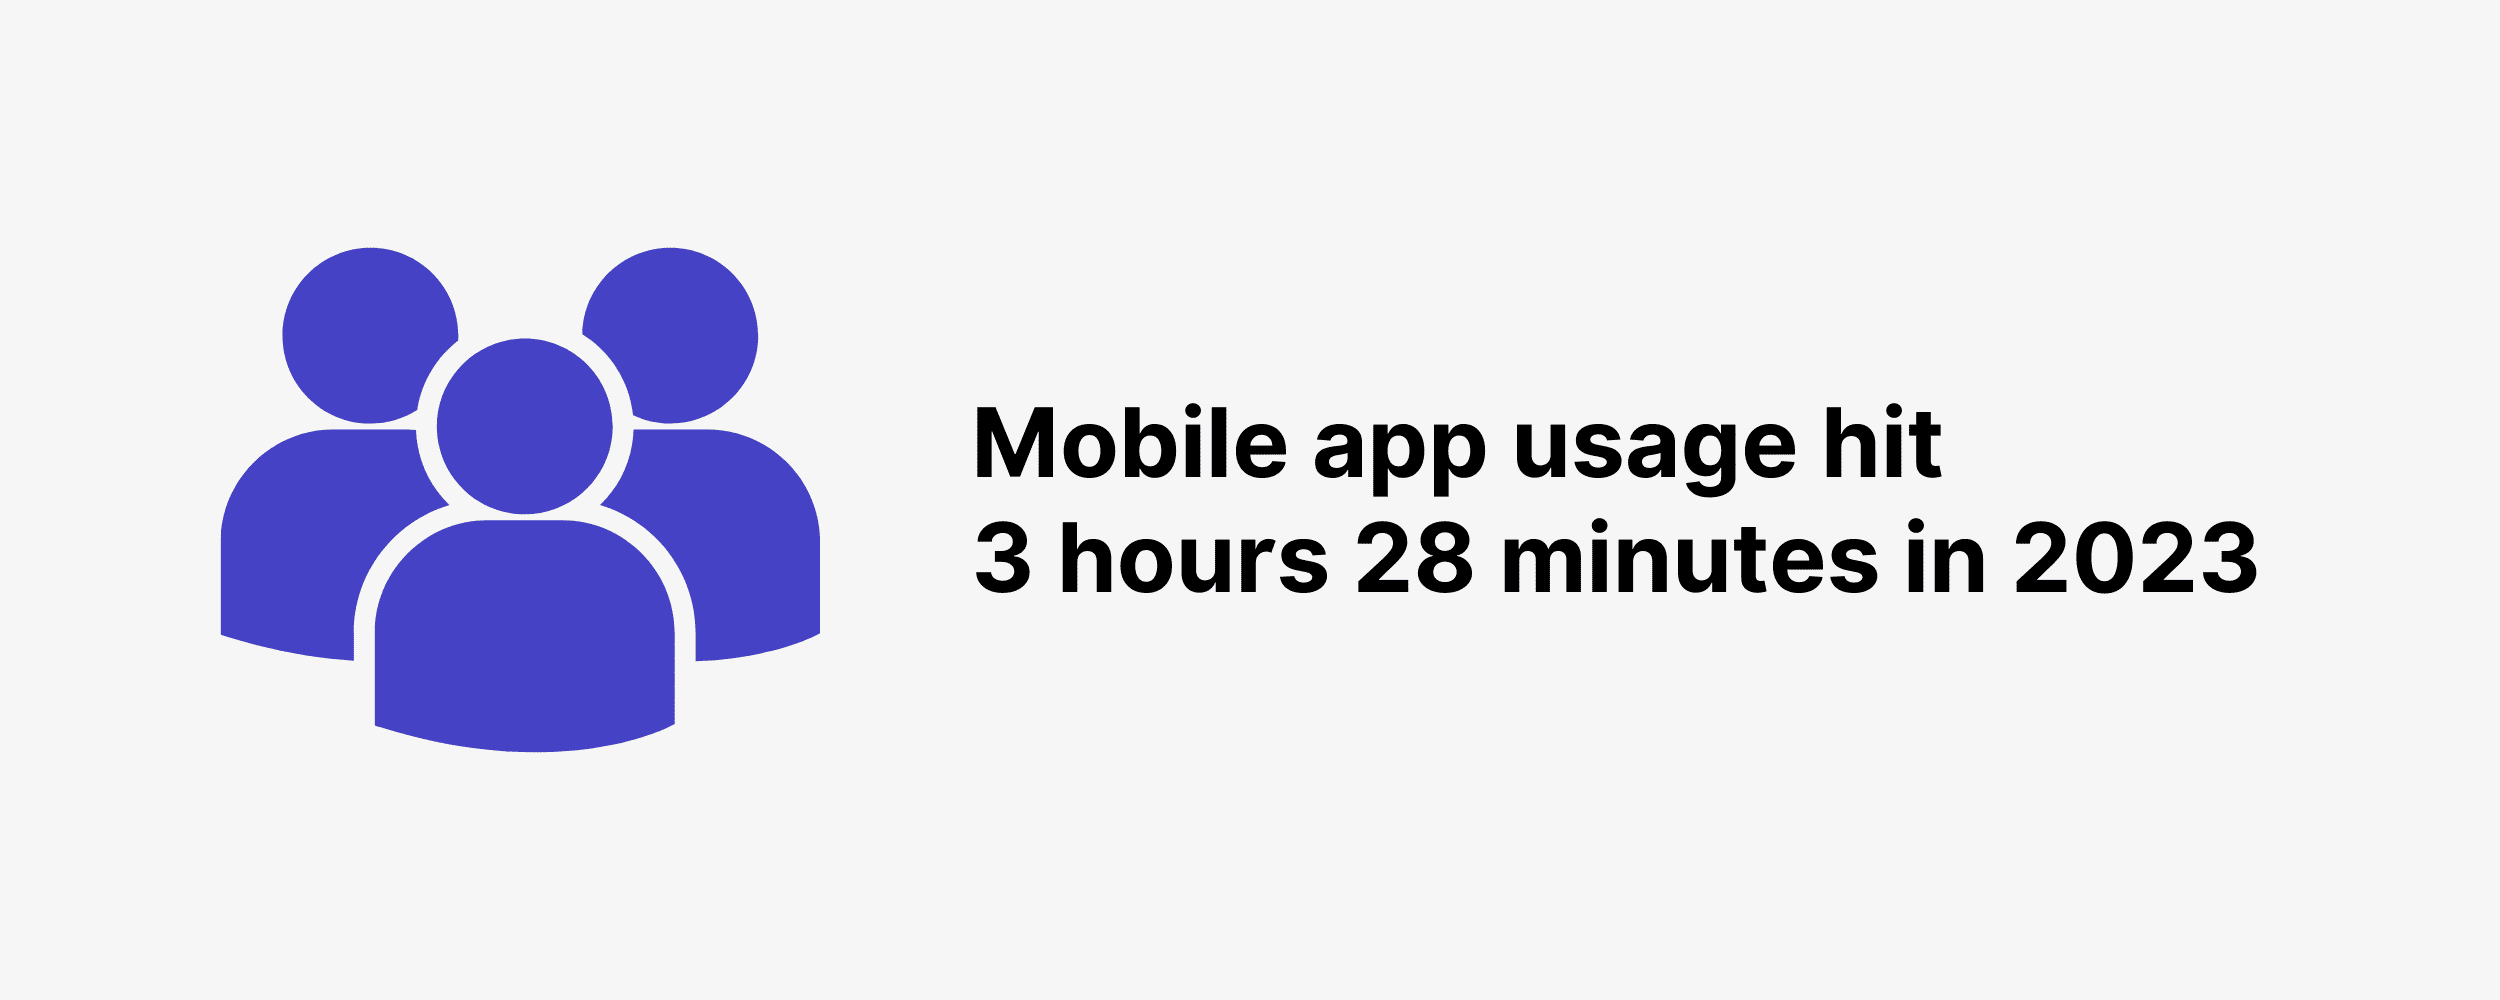
Specifically, mobile app usage hit 3 hours 28 minutes in 2023 vs. 51 minutes spent on web browsers.
Source: eMarketer
Conclusion
You’ve reached the end of my smartphone usage statistics for 2024.
It’s clear that our smartphone usage evolves over time and there is a noticeable trend of growing screen time.
It will be interesting to see how it compares to what comes next in the upcoming years.
The post Smartphone Usage Statistics appeared first on Backlinko.


